How to read a domain's authority trend: steps, slides and gaps
Published
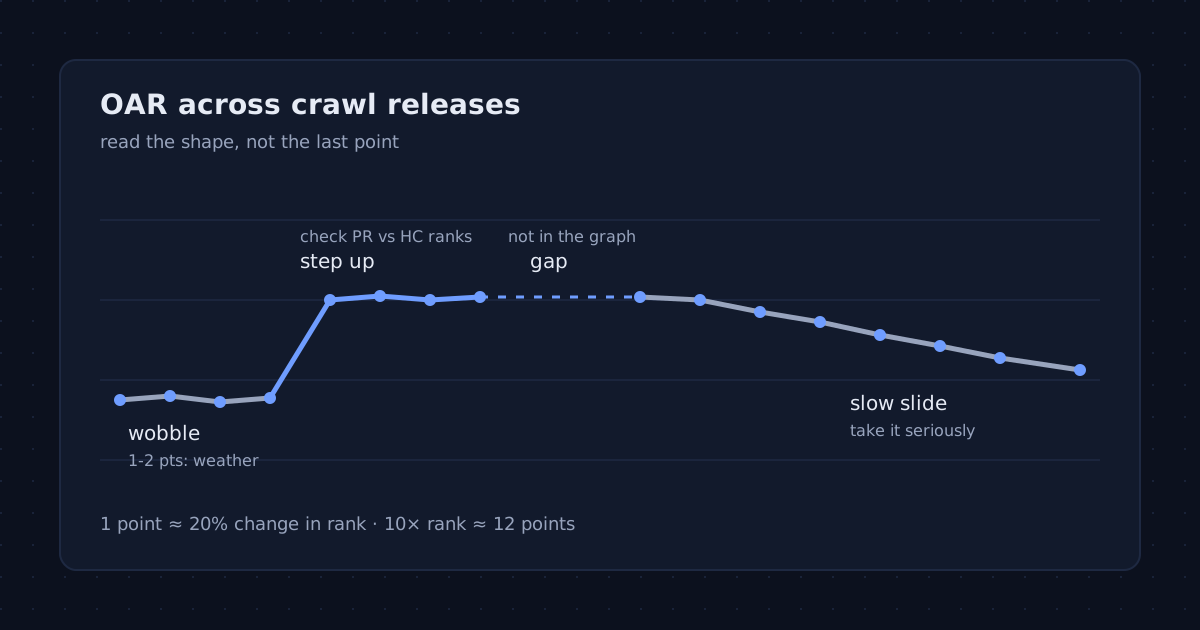
A single authority score tells you where a domain stands today. The line of scores behind it tells you where it is going, and that is usually the more useful answer: a 40 that has climbed steadily for a year is a different site from a 40 that was a 48 last spring. This guide explains how to read the trend chart on a domain’s page here, what each common pattern usually means, and which movements are just noise.
Everything below follows from how the Open Authority Rating is built, which is published in full on the methodology page. No guessed formulas and no promises about rankings: OAR measures a domain’s position in the public link graph, nothing more.
First, what one point is worth
OAR is logarithmic. Each crawl release of Common Crawl’s web graph ranks more than 120 million domains, and the score turns a domain’s rank into a number between 0 and 100 so that every tenfold change in rank moves the score by roughly the same amount. On the current reference curve that is about 12 points per tenfold step, which means a single point corresponds to a rank change of roughly 20%.
| Rank in the graph | OAR |
|---|---|
| 10,000 | 51 |
| 100,000 | 38 |
| 200,000 | 34 |
| 500,000 | 29 |
| 1,000,000 | 26 |
Two things follow. Small moves are real but modest: dropping from 38 to 34 means the domain’s rank roughly halved. And big moves are rare for a reason: climbing ten points means overtaking millions of domains, which takes far more than a handful of new links.
Why a score can move when nothing changed
Each score is relative to its own release. When Common Crawl publishes a new graph, every domain is re-ranked against everyone else in it. If other sites gained links faster than yours, your rank slips even though nothing on your side changed; if a large part of the web around you lost links, you can rise without lifting a finger. Releases also differ in size and in which parts of the web the crawl reached.
So treat a move of one or two points between two releases as weather, not news. What matters is a move that persists across several releases, or one that is too large to be weather.
The five patterns you will see
1. A flat line with a little wobble
The most common shape, and a healthy one for an established site. The domain holds its place in the graph from release to release; the wobble is the relative re-ranking described above. Nothing to do here except keep earning links the slow way.
2. A step up
A clear rise of several points that then holds. Good reasons include coverage on well-connected sites, a widely linked launch, or a site migration that finally moved the links of an old domain onto this one. Before you celebrate, look at the two ranks on the domain page. When the PageRank rank improved far more than the harmonic-centrality rank, the new links probably come from a dense cluster of sites rather than from across the web, which is the pattern link farms leave and the reason harmonic centrality carries 70% of the weight.
3. A step down
A drop of several points that stays down. Usually the domain lost links that mattered: a partner removed a sitewide link, a big linking site went offline, or a migration left old URLs without redirects so their links now point at nothing. Compare with what changed on your side around that release; the cause is usually findable.
4. A slow slide
A small loss in almost every release. This is the pattern to take most seriously, because no single release looks alarming. It means the sites that link to the domain are disappearing or being overtaken, and nothing is replacing them. For a domain you are thinking of buying, it also means today’s number is the best it will look.
5. Gaps
A dashed mark instead of a point means the domain was provably absent from that release’s graph. We never estimate a number for a missing release, so the gap is the honest answer. Several gaps in a row usually mean the domain expired, sat empty, or was too small to appear; a domain that comes back after a long gap is often running on leftover links that nobody maintains.
Comparing two trends
Trends are most useful side by side. Compare two domains and look at the direction of each line rather than the gap between today’s numbers: a competitor three points behind you and climbing is closer than one five points behind and sliding. Keep in mind that a new domain may have only one or two releases of history, which is not enough to call a direction.
If you build and sell small sites, as in Online Money Blog’s guide to making your own websites, the trend is also the honest thing to show a buyer: it is harder to dress up than a single number.
Keep watching without checking by hand
Scores update when a new release is ingested, not daily, so checking more often than that tells you nothing new. A free account lets you track domains: your dashboard then lists each one with its latest score, how far it has moved since you started tracking and its recent trend, and can sort them by the biggest change, so the domain that moved most is at the top after each release.
A quick checklist
- Ignore moves of one or two points between two releases.
- Remember that one point is roughly a 20% change in rank.
- Ask whether a step persists over the next release before acting on it.
- Check the PageRank and harmonic-centrality ranks after any sudden rise.
- Take a slow slide more seriously than a single drop.
- Read gaps as absence from the graph, never as a zero.
You can look up any domain to see its trend, and read how the numbers are built on the methodology page.
OAR measures a domain’s position in the public link graph. It does not measure content quality, traffic or trustworthiness, and it predicts nothing about search rankings.